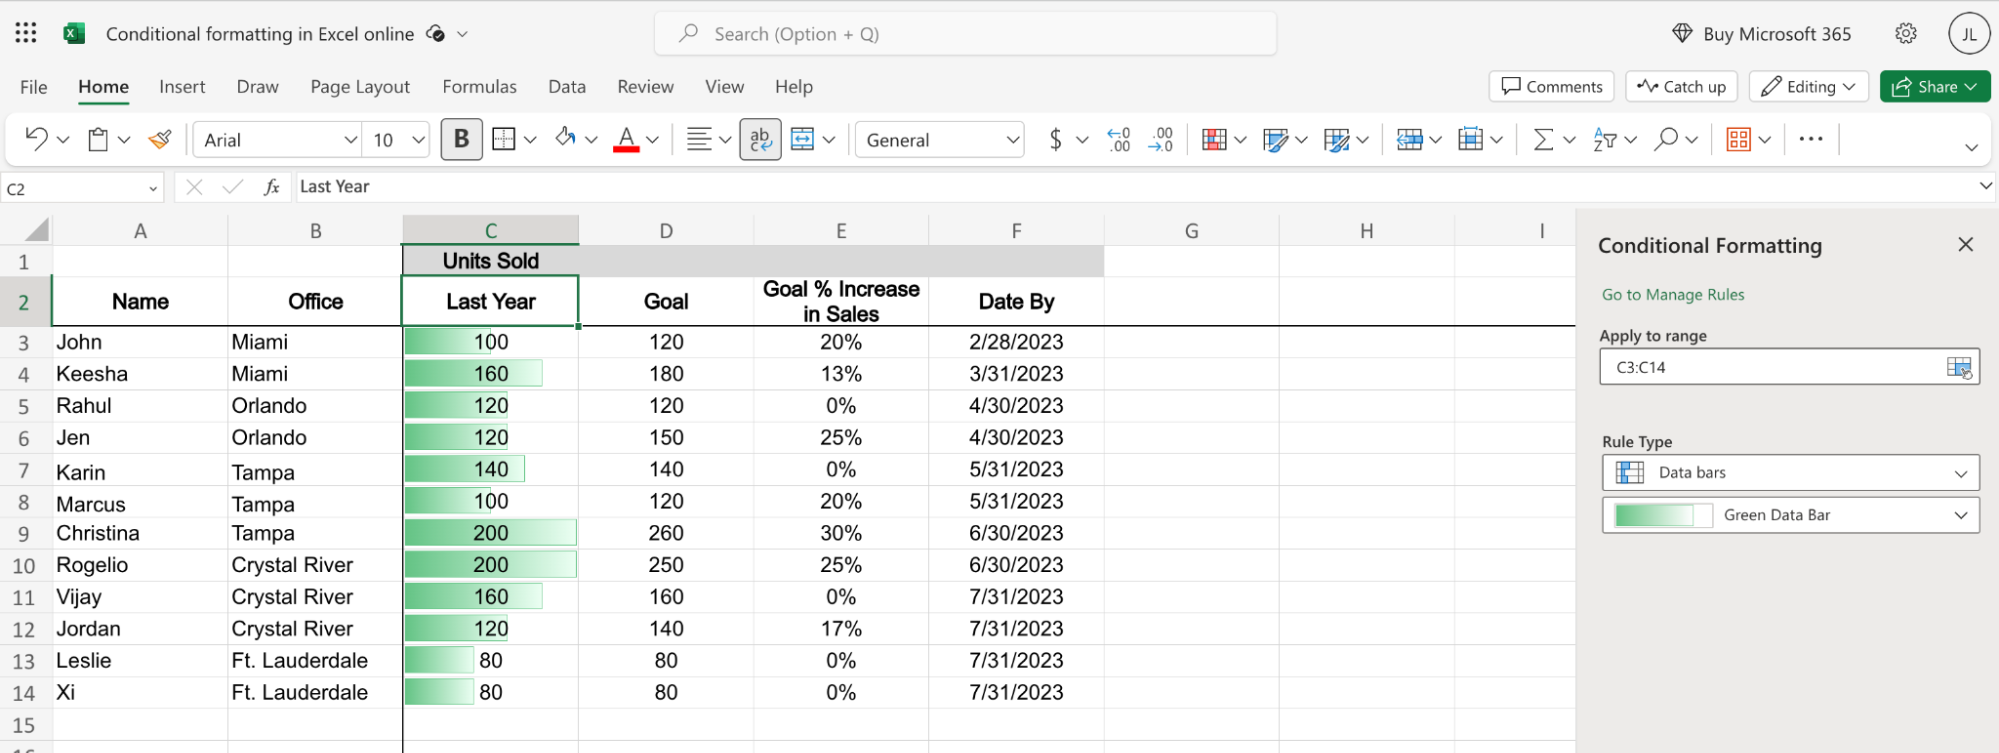
Master the art of efficiency with these game-changing Excel hacks! Dive into the world of spreadsheet wizardry and streamline your workflow like never before. Uncover secret shortcuts and unleash the power of formulas to transform daunting data into insightful, organized information. From conditional formatting tricks that bring your data to life to pivot table mastery that simplifies complex analysis, these hacks will revolutionize how you handle spreadsheets.
Say goodbye to endless manual tasks and embrace the potential of Excel's functionalities. Discover how toautomate processes, create dynamic charts with a few clicks, and even utilize lesser-known features that can make a monumental difference in your productivity. With these Excel hacks at your fingertips, you'll be navigating spreadsheets effortlessly, saving time, and achieving remarkable results in no time!
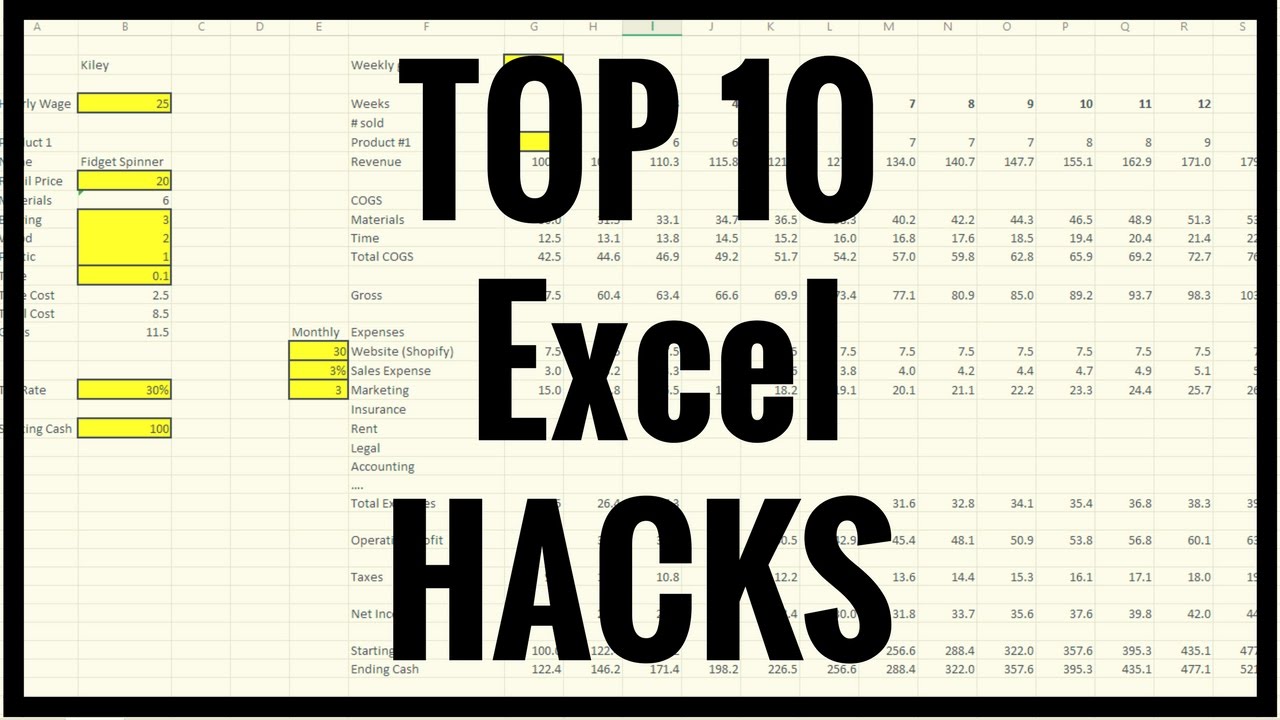
10 Excel Hacks You Need To Know
Here are the 10 must know Excel hacksfor 2023:
1. Keyboard shortcuts -Keyboard shortcuts are a great way to save time and effort when working in Excel. There are many shortcuts available, so learning a few of the most common ones can make a big difference. For example, Ctrl+C to copy, Ctrl+V to paste, and Ctrl+X to cut are all essential shortcuts.
2. F4 to repeat last action -The F4 key is a handy shortcut that can be used to repeat the last action you performed. This can be especially useful for tasks that you do frequently, such as copying and pasting data.
3. Name cells for reference -Naming cells makes it easier to reference them in formulas. This can make your formulas more readable and easier to understand. To name a cell, click in the box to the left of the formula bar and type in a name for the cell.
4. Shift columns holding Shift -To move a column of data, click and hold the column header and drag it to the desired location. While holding the Shift key, you can also drop the column header into another column to insert it there.
5. Find formula -The Find formula feature can be used to locate a specific formula in a worksheet. To use this feature, press Ctrl+F and then click the Find Options tab. In the Find what box, type in the formula you are looking for.
6. Keep your leading zeros -When entering numbers that start with zeros, Excel may automatically remove the leading zeros. To prevent this, format the cells as text before entering the numbers. To do this, select the cells you want to format, right-click, and choose Format Cells. In the Format Cells dialog box, select the Text tab and then click OK.
7. Remove background picture -To remove a background picture from a worksheet, click the Page Layout tab and then click the Background button. In the Background drop-down menu, select Fill Effects and then select No Fill.
8. Sequence date list -To create a sequence of dates in Excel, you can use the AutoFill feature. To do this, type in the starting date in a cell and then click and drag the fill handle down to the desired range of dates.
9. Reply function font stencil -The Reply function can be used to add a comment to a cell. However, the default font for the comment is very small and difficult to read. To make the comment easier to read, you can use a font stencil. To do this, right-click the comment and choose Format Comment Bubble. In the Format Comment Bubble dialog box, click the Font tab and then select the desired font stencil
10. Switch function -The Switch function is a versatile function that can be used to return different values based on a specified condition. The Switch function is similar to the IF function, but it can be used to handle multiple conditions more easily.
These are just a few of the many Excel hacks that you can use to save time and improve your productivity. With a little practice, you can become an Excel expert and master these powerful tools.
Familiarize Yourself With Keyboard Shortcuts
Absolutely! Mastering keyboard shortcuts is an essential skill for any Excel user, as it can significantly enhance your efficiency and productivity. Here are some of the most common and useful keyboard shortcuts in Excel:
Basic Editing Shortcuts
- Ctrl+C -Copy selection
- Ctrl+X -Cut selection
- Ctrl+V -Paste selection
- Ctrl+Z -Undo last action
- Ctrl+Y -Redo last action
- F2 -Edit cell
- Delete -Delete active cell or selection
- Enter -Complete cell editing and move to the next cell
Navigation Shortcuts
- Arrow keys -Move around the worksheet
- PgUp/PgDn -Move between worksheets
- Ctrl+Home -Go to the first cell in the worksheet
- Ctrl+End -Go to the last cell in the worksheet
- Ctrl+Space -Select the entire active sheet
- Alt+F11 -Open the Visual Basic Editor
Formula And Function Shortcuts
- F4 -Repeat last action (including formulas)
- F9 -Calculate active sheet
- Shift+F3 -Name Manager
- Ctrl+F -Find
- Ctrl+H -Replace
- Ctrl+Shift+F12 -Define Name
Formatting Shortcuts
- Ctrl+B -Bold selected text
- Ctrl+I -Italicize selected text
- Ctrl+U -Underline selected text
- Ctrl+5 -Center alignment
- Ctrl+L -Left alignment
- Ctrl+R -Right alignment
- Ctrl+Shift+> -Increase font size
- Ctrl+Shift+< -Decrease font size
Additional Shortcuts
- Alt or F10 -Activate the ribbon
- Alt+P -Print Preview
- F12 -Save
- Ctrl+Shift+S -Save As
Data Visualization And Presentation Techniques
Data visualizationand presentation techniques are essential for communicating complex information in a clear and concise way. By using effective visuals, you can help your audience understand patterns, trends, and relationships in data that would be difficult to grasp from text alone.
Common Data Visualization Techniques
There are many different data visualization techniques that can be used to communicate information effectively. Some of the most common techniques include:
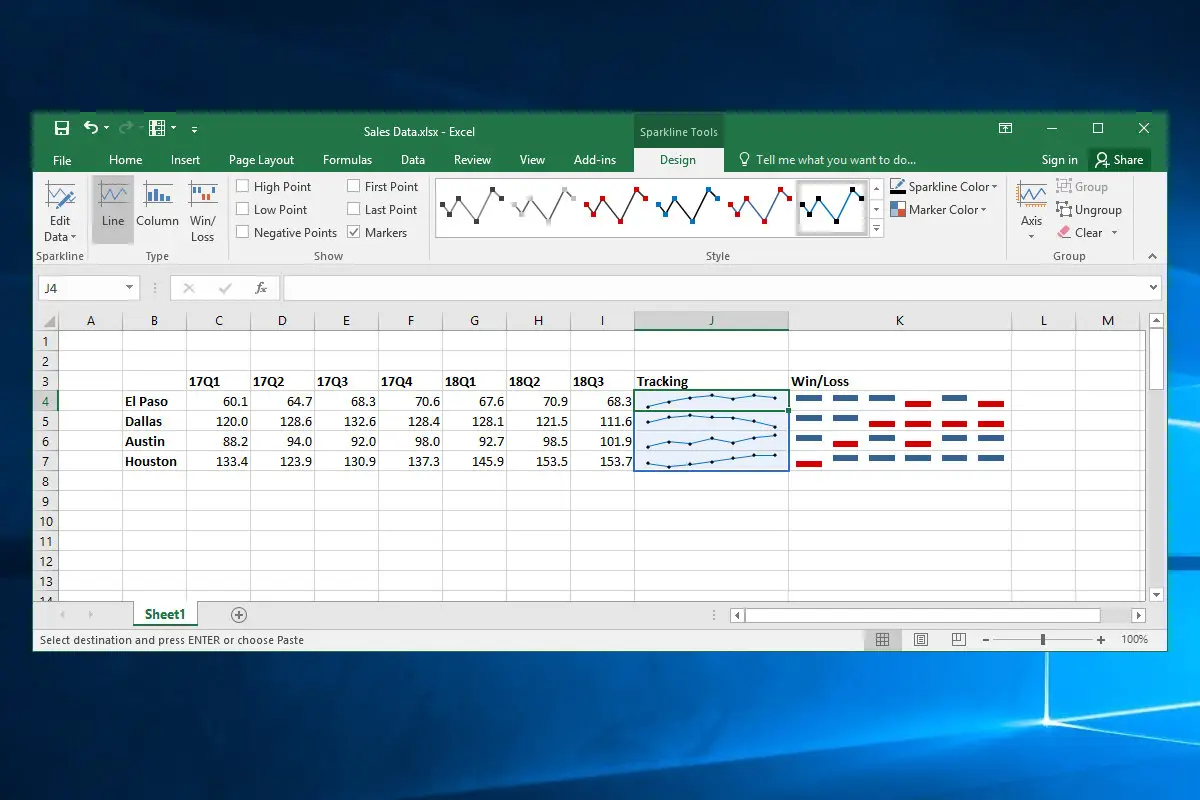
- Line charts -Line charts are used to show trends over time. They are created by plotting data points on a coordinate plane and connecting the points with lines.
- Bar charts -Bar charts are used to compare different categories of data. They are created by plotting bars of different heights for each category.
- Pie charts -Pie charts are used to show the proportion of a whole that each category represents. They are created by dividing a circle into slices, where the size of each slice represents the proportion of the whole.
- Scatter plots -Scatter plots are used to show the relationship between two variables. They are created by plotting data points on a coordinate plane, where each point represents a pair of values.
- Heatmaps -Heatmaps are used to show the density of data points in a two-dimensional space. They are created by assigning colors to data points based on their density, where darker colors represent denser areas.
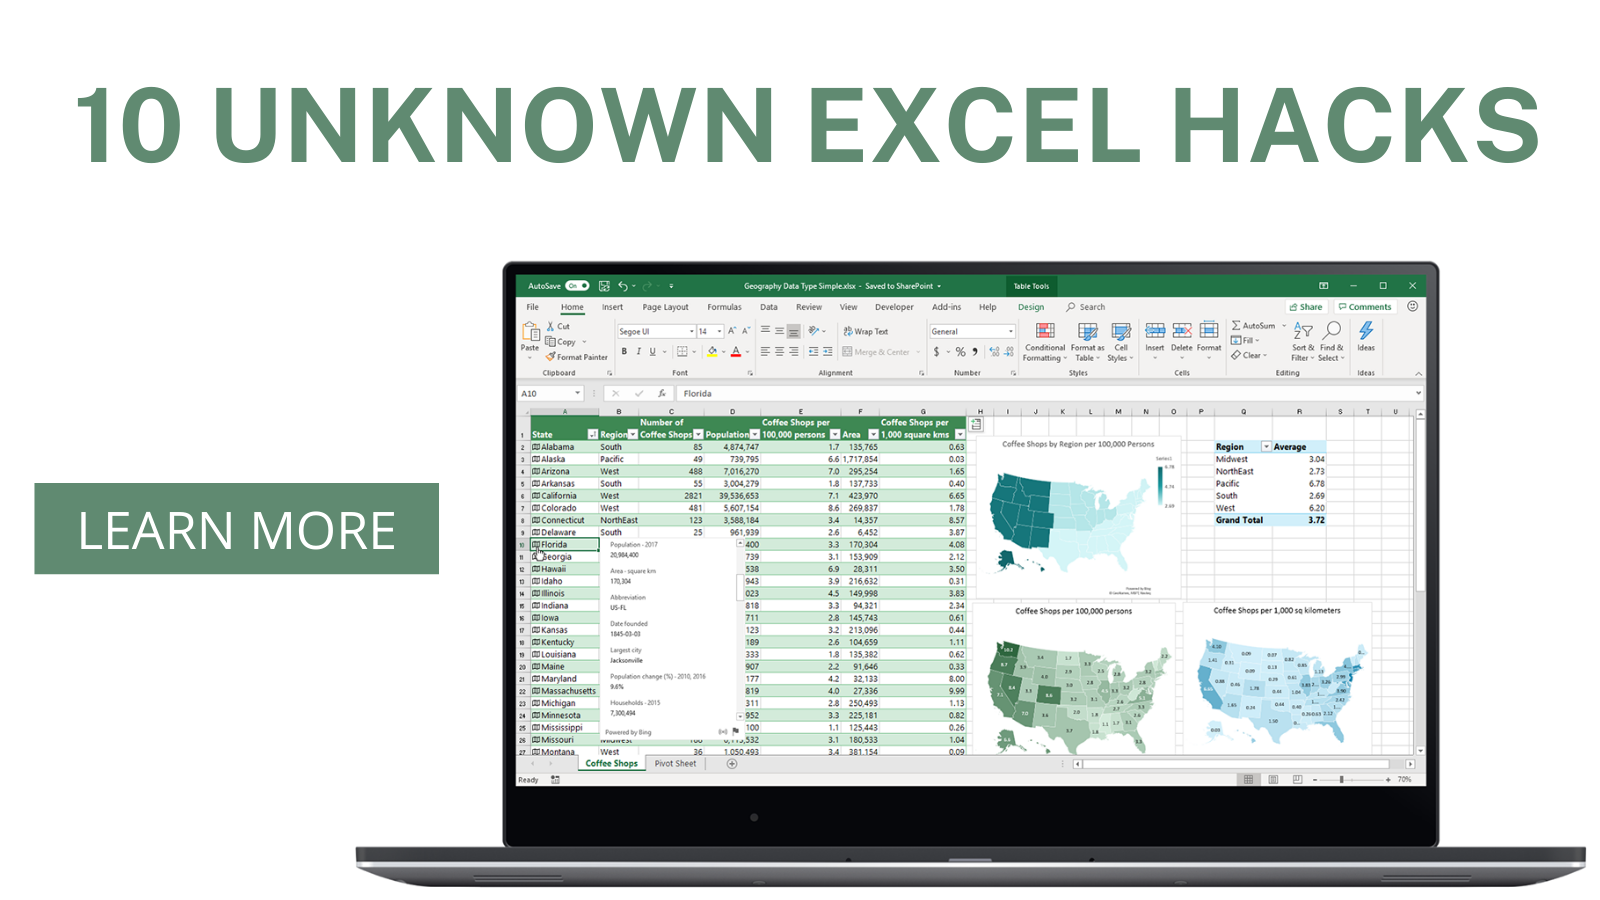
- Maps -Maps are used to show data that is geographically distributed. They are created by overlaying data points or other visualizations on a map of the world or a specific region.
Effective Data Presentation Techniques
In addition to choosing the right visualization technique, it is also important to use effective presentation techniques to communicate your data effectively. Some key tips for effective data presentation include:
- Keep it simple -Don't try to cram too much information into one visualization. Use clear and concise labels and avoid using too many colors or patterns.
- Use color effectively -Color can be a powerful tool for highlighting important information and drawing attention to patterns and trends. However, use color sparingly and avoid using too many different colors.
- Use white space effectively -White space can help to make your visualizations more readable and easier to understand. Don't overcrowd your visualizations with too much data or too many elements.
- Use storytelling -Tell a story with your data. Use your visualizations to guide your audience through the data and help them to understand the key takeaways.
- Use the right tools -There are many different data visualization tools available, so choose the one that is right for your needs and your audience.
Time-Saving Automation And Productivity Tips
Automate Repetitive Tasks
Many tasks can be automated, such as sending emails, scheduling appointments, and generating reports. This can free up your time to focus on more strategic work.
There are a number of tools available to help you automate tasks, including:
- IFTTT (If This Then That)- A free web-based service that lets you connect different apps and services to create automations.
- Zapier- A cloud-based automation platform that lets you connect hundreds of different apps and services.
- Microsoft Power Automate- A cloud-based automation platform from Microsoft that lets you automate tasks across a variety of Microsoft services.
Use Templates
Templates can be used to save time and create consistency in your work. For example, you can create templates for documents, emails, and presentations.
There are a number of places to find templates, including:
- Microsoft Office- Microsoft Office offers a variety of templates for Word, Excel, PowerPoint, and other applications.
- Google Docs- Google Docs offers a variety of templates for documents, spreadsheets, presentations, and other types of files.
- Canva- Canva is a free online design platform that offers a variety of templates for social mediagraphics, presentations, and other types of designs.
Use Keyboard Shortcuts
Keyboard shortcuts can save you a lot of time and effort. There are keyboard shortcuts for almost everything you can do in Excel, Word, PowerPoint, and other applications.
You can find a list of keyboard shortcuts for most applications in the Help menu.
Use Batch Processing
Batch processing can be used to automate tasks that you perform on multiple files at once. For example, you can use batch processing to rename multiple files, convert multiple files to a different format, or resize multiple images.
There are a number of tools available to help you batch process files, including:
- Rename Master- A free Windows application that lets you rename multiple files at once.
- Convertio - A free online tool that lets you convert multiple files to a different format.
- IrfanView- A free Windows application that lets you view, edit, and convert images.
Use Project Management Tools
Project management tools can help you plan, track, and manage your projects. This can help you to stay on track and avoid deadlines.
There are a number of project management tools available, including:
- Asana - A free web-based project management tool that lets you create tasks, set deadlines, and track progress.
- Trello- A free web-based project management tool that uses a kanban board to visualize your workflow.
- Basecamp- A paid web-based project management tool that offers a variety of features, including task management, file sharing, and time tracking.
By following these tips, you can save time and improve your productivity.
Excel For Specialized Tasks
Excel is a powerful toolthat can be used for a wide variety of tasks, including data analysis, financial modeling, and project management. However, it can also be used for a number of specialized tasks, such as:
- Statistical analysis -Excel has a number of built-in functions for statistical analysis, such as mean, median, mode, standard deviation, and correlation. You can also use Excel to create charts and graphs to visualize your data
- Financial modeling -Excel is a great tool for financial modeling. You can use Excel to create budgets, forecasts, and other financial reports. You can also use Excel to perform financial calculations, such as net present value and internal rate of return.
- Project management -Excel can be used to create project schedules, track progress, and manage resources. You can also use Excel to create Gantt charts and other project management tools.
- Data visualization -Excel has a number of built-in tools for data visualization, such as charts, graphs, and maps. You can use these tools to create visually appealing and informative representations of your data
- Programming -Excel has a built-in programming language called Visual Basic for Applications (VBA). You can use VBA to automate tasks, create custom functions, and extend the functionality of Excel.
- Web scraping-Excel can be used to scrape data from the web. You can use the Power Query feature in Excel to import data from websites and other online sources.
These are just a few examples of the specialized tasks that can be performed using Excel. With its wide range of features and functions, Excel is a versatile tool that can be used for a variety of purposes.
Frequently Asked Questions About Excel Hacks
Is Excel A Good Skill?
What are Excel skills? Excel is a program within the Microsoft Office Suite. It contains a spreadsheet that can automatically input, calculate and analyze data , which makes it a valuable skill for the workplace. Employees can use Excel to accomplish an abundance of daily tasks
What Type Of Skill Is Excel?
Excel is an important, in-demand skill in countless industries. Advanced Excel skills include the ability to produce graphs and tables, use spreadsheets efficiently, and perform calculations and automation to process large volumes of data.
Can We Create Games In Excel?
Making a game in Microsoft Excel is easy and fun. To get started, open a new spreadsheet in Excel and create a new sheet. Then, create your game board, which can be a grid of squares or a map of a virtual world. To make the game interactive, add functions and formulas to the cells.
Conclusion
Delving into the realm of Excel hacks offers an invaluable advantage in navigating the complexities of data management and analysis. The array of time-saving shortcuts, advanced functions, and hidden features discovered throughout this journey not only amplifies productivity but also empowers users to transform raw data into actionable insights efficiently.
Moreover, the continuous learning and exploration of Excel's capabilities are pivotal. As new updates and functionalities emerge, staying updated with the latest Excel hacks ensures staying ahead in leveraging this powerful tool to its fullest potential. Ultimately, mastering these hacks isn't just about becoming proficient in Excel; it's about unlocking endless possibilities to innovate, solve problems creatively, and drive meaningful results across diverse personal and professional endeavors.